Microplastics in drinking water: a quarter million particles in every liter from a PET bottle
A 2024 Columbia University study found an average of 240,000 nanoplastic particles in every liter of bottled water from PET bottles — 700× more than older methods had shown. Particles smaller than a micrometer cross the intestinal wall into the bloodstream and have been found in blood, lungs, the placenta, and even the testicles. The article examines both the study's methodological controversies and the still-unknown health effects of nanoplastics.
When you buy a litre of bottled water in a PET bottle, you get an average of 240,000 detectable plastic particles along with it. Roughly nine out of ten are nanoplastics — fragments smaller than one micrometre, that is, a thousandth of a millimetre. They are so tiny that they can pass through the intestinal wall and the lungs into the bloodstream and from there into the organs. Research to date has demonstrated the presence of plastic particles in human blood, lungs, intestines, stool, and even in reproductive tissues, including the placenta and testes.
This figure comes from a study by researchers from Columbia University and Rutgers University, published in January 2024 in the journal Proceedings of the National Academy of Sciences (PNAS). The team, led by Naixin Qian, used a new method of stimulated Raman scattering spectroscopy (SRS) with two lasers, which made it possible for the first time to count and identify nanoplastic particles in bottled water. They analysed five samples from each of three commonly sold brands in the USA and measured a range of 110,000 to 370,000 particles per litre (average 240,000 ± 130,000).
Source: Qian, N. et al. (2024). Rapid single-particle chemical imaging of nanoplastics by SRS microscopy. PNAS, 121(3), e2300582121. doi: 10.1073/pnas.2300582121
For comparison: an older study from 2018 (Mason et al.) found an average of 325 microplastic particles per litre in bottled water — but at that time it was not technically possible to detect nanoplastics. With the new method, the measured count is approximately 700× higher.
It should be noted that the study faced professional criticism. In November 2024, Dušan Materić published an objection in the same journal, arguing that the control samples (Milli-Q distilled water) showed a comparable level of contamination to the bottled water samples, and that the quantitative conclusions are therefore unreliable. In their reply, the authors argued that the Milli-Q water itself was contaminated with plastic particles and was therefore not a suitable control sample — instead, they used clean filtration membranes exposed to the same laboratory environment. This debate shows that the measurement of nanoplastics is still in an early stage and the results must be interpreted with caution.
Sources: Materić, D. (2024). Nanoplastics measurements must have appropriate blanks. PNAS, 121(48), e2411099121. | Min, W. (2024). Reply to Materić. PNAS, 121(48), e2415874121.
The study identified seven common polymers in bottled water: polyamide (a type of nylon), polypropylene, polyethylene, polymethyl methacrylate, polyvinyl chloride, polystyrene, and polyethylene terephthalate (PET). Surprisingly, the most frequent was not the PET from the bottle itself, but polyamide — a material used in membrane filters for purifying water before it is bottled. The PET particles are probably released when the bottle is squeezed, when the cap is repeatedly opened, and through exposure to heat.
The seven identified polymers, however, made up only about a tenth of all the nanoparticles found. What makes up the remaining nine tenths, scientists do not yet know — the method identified millions of additional particles that did not match any of the seven plastics in the reference library. If these are also nanoplastics, the actual count could be many times higher.
A direct comparison of tap and bottled water at the nanoplastic level is still lacking — at the time of publication, the authors of the Columbia University study were only just beginning measurements in municipal water supplies (Boston, St. Louis, Los Angeles). However, preliminary tests and older studies focused on microplastics suggest that tap water contains an order of magnitude fewer plastic particles than bottled water.
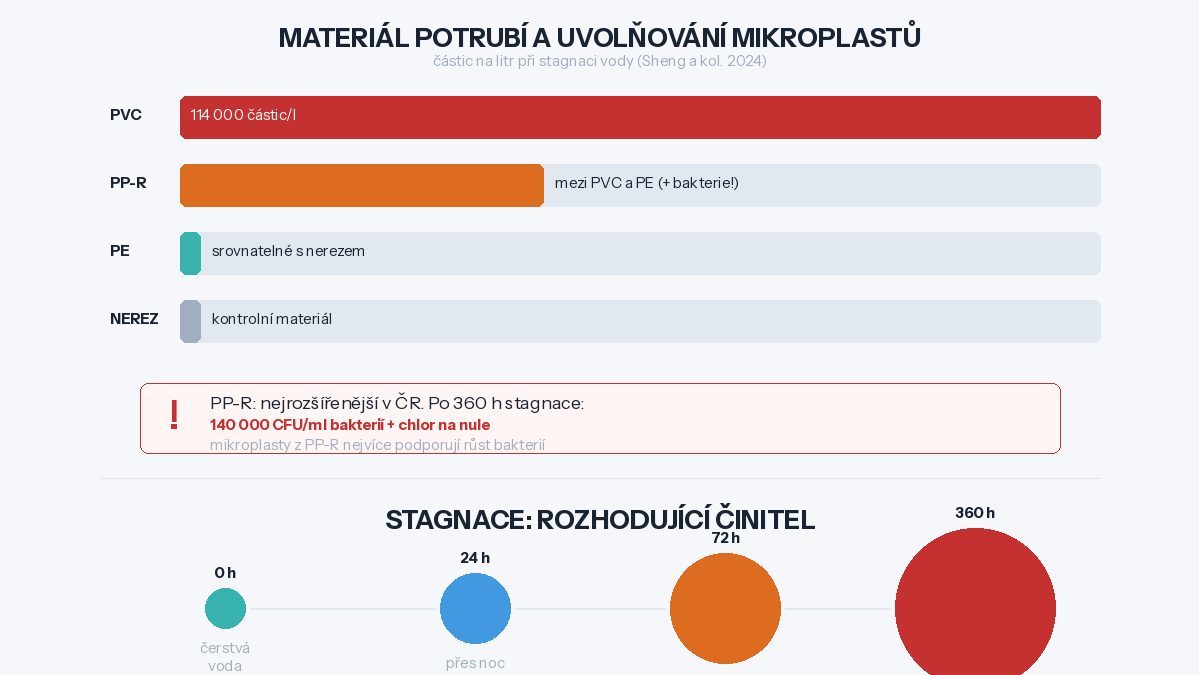
A study by Sheng et al. (2024) measured concentrations of microplastics (1–40 μm) in standing water in various types of piping. In PVC pipes, the concentration of released microplastics reached as high as 114,000 particles per litre (1.14 × 10⁵), while polyethylene pipes released the fewest particles — statistically no different from stainless-steel pipes.
Source: Sheng, K. et al. (2024). Release of microplastics from pipe materials and their impact on stagnant water. Preprint SSRN: 5017572.
While tap water contains relatively few plastic particles when it leaves the treatment plant, its journey through the piping to your tap makes the situation significantly worse. Plastic pipes — especially those made of PVC, PP-R, and PE — gradually break down through the action of chlorine in disinfected water, temperature, and mechanical wear, releasing microplastics directly into the drinking water.
The study by Sheng et al. demonstrated that PVC pipes release the most microplastics of all the tested materials — up to 114,000 particles per litre when water stagnates. PVC was widely used in Czech distribution systems particularly in the period 1990–2000.
Polypropylene pipes (PP-R) are today the most common material for internal distribution systems in Czech households. In terms of microplastic release, they rank between PVC and PE.
A different finding, however, is crucial: PP-R microplastics exhibit the highest capacity to support the proliferation of bacteria. After 360 hours of stagnation, the count of heterotrophic bacteria in the PP-R sample reached 1.40 × 10⁵ CFU/ml, while the chlorine level dropped to zero. This means that PP-R microplastics not only pollute the water with plastic particles but also create an environment favourable to the growth of pathogenic microorganisms.
A separate study by Yang et al. (2024), published in the Journal of Hazardous Materials, confirmed that chlorination, heating, and freeze-thaw cycles accelerate the release of microplastics and chemical substances from PP-R pipes, and that these substances increase the capacity to cause disease (virulence) and antibiotic resistance in the bacterial communities in drinking water.
Source: Yang, X. et al. (2024). Microplastics and chemical leachates from plastic pipes are associated with increased virulence and antimicrobial resistance potential of drinking water microbial communities. J. Hazard. Mater., 463, 132900. doi: 10.1016/j.jhazmat.2023.132900
The most recent study, from 2025 (published in the journal Water Research), demonstrated that a coating of living microorganisms (biofilm) on the inner surface of PP-R pipes increases microplastic release to 2.1 times that of control samples and accelerates the breakdown of the material through a combination of physical corrosion and biochemical decomposition.
Source: Xiu, J. et al. (2025). Biofilm induced microplastics and microbial metabolites release from Polypropylene Random pipes in drinking water distribution systems. Water Res., 288(Pt A), 124626. PMID: 40974892.
Polyethylene pipes (PE) released the fewest microplastics in the tests — statistically no different from stainless-steel pipes. This is an important finding from the standpoint of choosing a material for drinking-water distribution systems.
The length of time water stagnates in the piping is one of the decisive factors. According to the available studies, stagnation can increase the concentration of microplastics in the water up to tenfold, especially in ageing PVC systems. In PVC pipes, the concentration rose linearly throughout the 360-hour experiment. In PP-R, there was a sharp increase in the first three days, followed by stabilisation.
The scientific community does not yet have a definitive answer to the question of exactly how microplastics and nanoplastics harm human health. A 2019 report by the World Health Organization (WHO) concluded that the health risks from microplastics in drinking water are low based on the evidence then available, but it also called for more intensive research — especially in the area of nanoplastics, which at that time could not be reliably measured.
Source: WHO (2019). Microplastics in drinking-water. Geneva: World Health Organization.
A review study by Sajedi et al., published in the Journal of Hazardous Materials in 2025, analysed 141 scientific articles and identified the following potential chronic health effects of exposure to nano- and microplastics: respiratory diseases, reproductive problems, damage to the nervous system, and carcinogenicity. The study also emphasises that the knowledge to date is not sufficient for definitive conclusions, and that standardised measurement methods are only now emerging.
Source: Sajedi, S. et al. (2025). Unveiling the hidden chronic health risks of nano- and microplastics in single-use plastic water bottles: A review. J. Hazard. Mater., 495, 138948. doi: 10.1016/j.jhazmat.2025.138948
Particularly alarming is the ability of nanoplastics to cross biological barriers. As evolutionary biologist Zoie Diana of the University of Toronto noted, small particles can appear in various organs and cross membranes that they should not be able to pass through, including the blood-brain barrier that protects the brain.
On the basis of the available scientific knowledge, the following recommendations can be formulated, graded according to cost and effectiveness.
After a longer absence (overnight, a holiday), let the water run for 30–60 seconds before using it for drinking or cooking. This removes the water that has been standing in the household pipes. For drinking and cooking, give preference to cold water — hot water from plastic distribution systems contains more released particles.
An add-on activated-carbon filter removes part of the microplastics larger than 10 μm and at the same time filters out chlorine and its by-products. Reverse osmosis is the most effective available technology — it removes more than 95% of plastic particles of all sizes. It is also advisable to consider the cost of maintenance and the regular replacement of filter cartridges.
Copper distribution systems produce no microplastics and have natural antimicrobial properties. If copper is unsuitable for budgetary reasons, PE pipes represent the best plastic option.
For the ordinary consumption of adults, tap water with appropriate filtration is more economically and ecologically advantageous and, in terms of microplastics, safer than bottled water in PET bottles. If you nevertheless use bottled water, store it in a cool place, out of direct sunlight, and do not reuse single-use PET bottles.
This overview has several important limitations that must be taken into account.
The Columbia University study analysed only three brands of bottled water sold in the USA and faces methodological criticism regarding the control samples (see above). The results for Czech brands (Dobrá voda, Aquila, and others) may differ — a comparable study for the Czech market does not yet exist.
The data on the release of microplastics from piping come from laboratory experiments with new pipes. Real household distribution systems aged 10–20 years or more may show markedly different (probably higher) values as a result of material degradation.
The share of PP-R in Czech household distribution systems is predominant, but precise statistical data on the proportions of individual materials are not publicly available.
The health effects of chronic exposure to nano- and microplastics on humans have not yet been sufficiently researched. Most of the data on toxicity come from studies on cell cultures and animal models.
Standardised methods for measuring and quantifying nanoplastics in drinking water are only now emerging. The results of various studies are therefore not always directly comparable.
Key sources:
Transparency of creation:
The concept, structure, and editorial line of the article are the work of the author, who prepared the content outline, established the key theses, and directed the entire creative process. Generative AI (Claude, Anthropic) was used as a technical tool for research, fact-checking, and fleshing out the author's draft.
The author edited the outputs throughout, verified the key findings, and approved the final wording. No part of the text was published without human review. All factual data were verified against the publicly available sources cited in the text.
This procedure is in compliance with the requirements of Art. 50 of EU Regulation 2024/1689 (the AI Act) on the transparency of AI-generated content. #poweredByAI
Read the Czech original on Médium.cz.
AI · Claude — machine translation, may contain inaccuracies.